About likesmoneystudies

I likes money

Are the Bulls Ready To Run ?

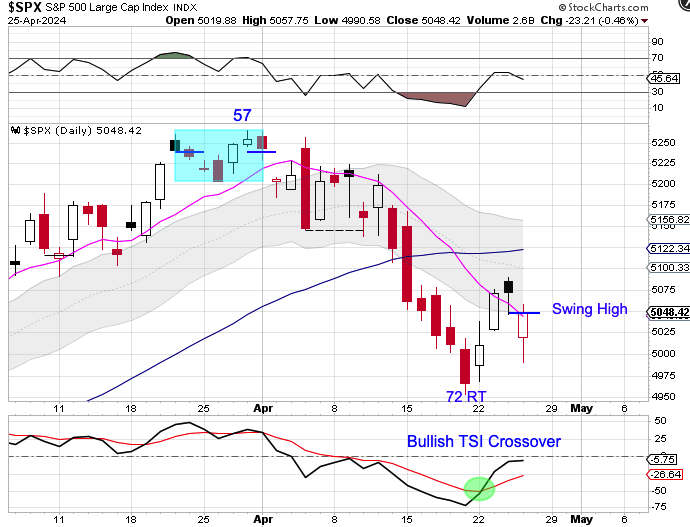
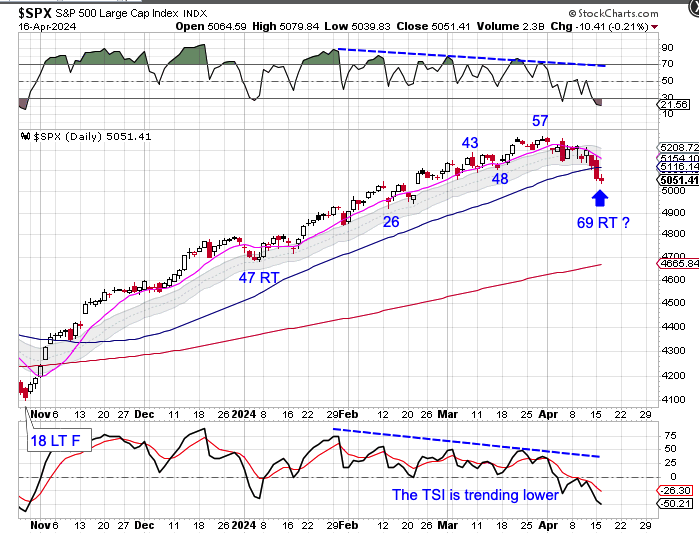
Stocks closed above the 10 day MA on Tuesday.

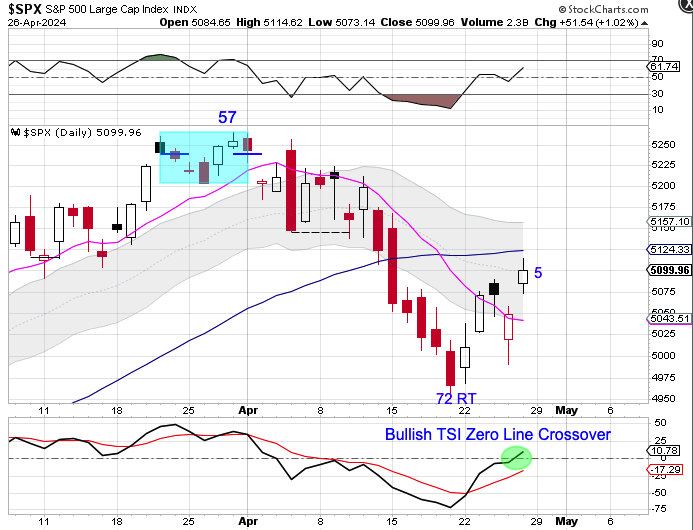
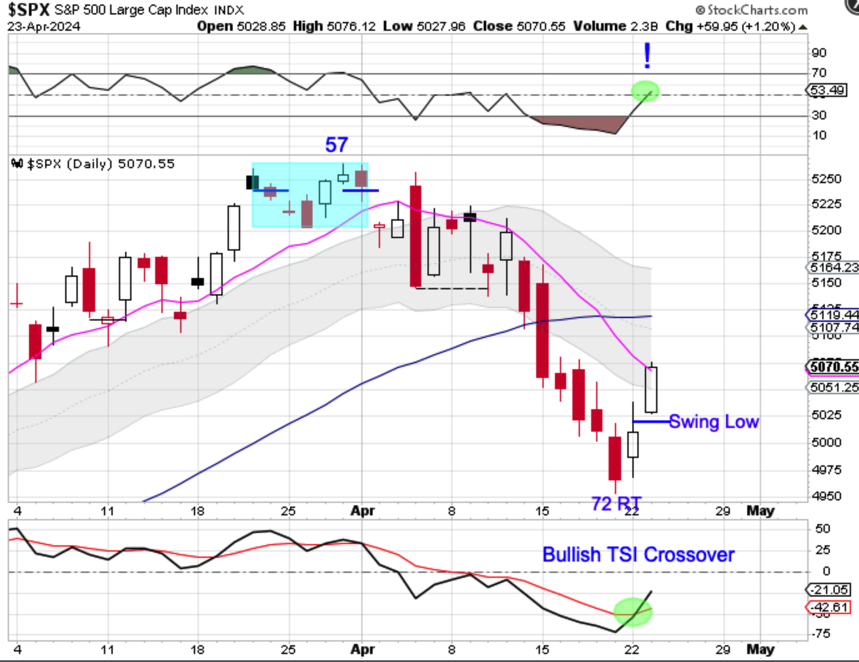
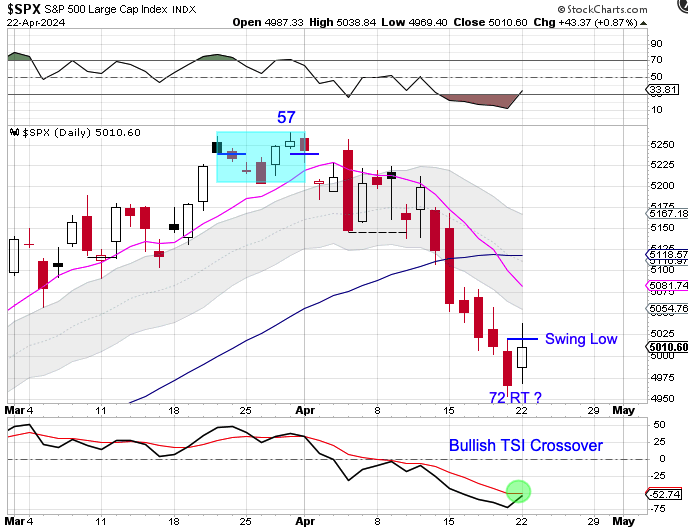
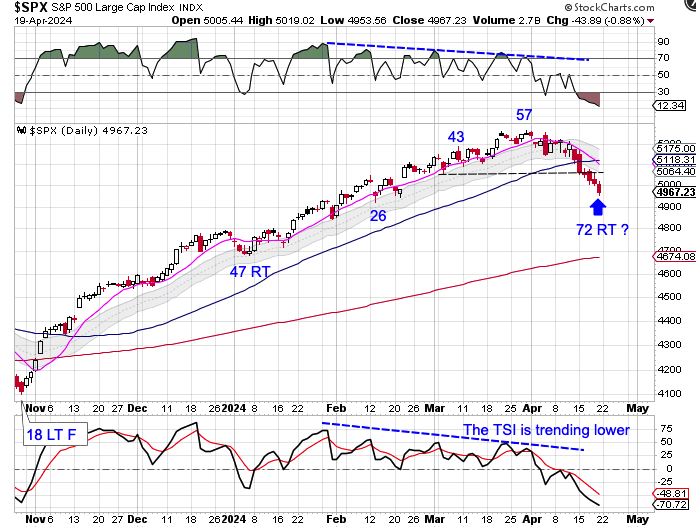
Stocks delivered bullish follow through on Friday confirming day 72 as the DCL. Stocks are now running into resistance at the 50 day MA. The decline into the day 72 DCL caused the 10 day MA to decline sharply, so stocks may need to consolidate to allow the 10 day MA to flatten out before it can turn higher. Stocks are currently in a daily downtrend. They will remain in their daily downtrend unless they close above the upper daily cycle band.

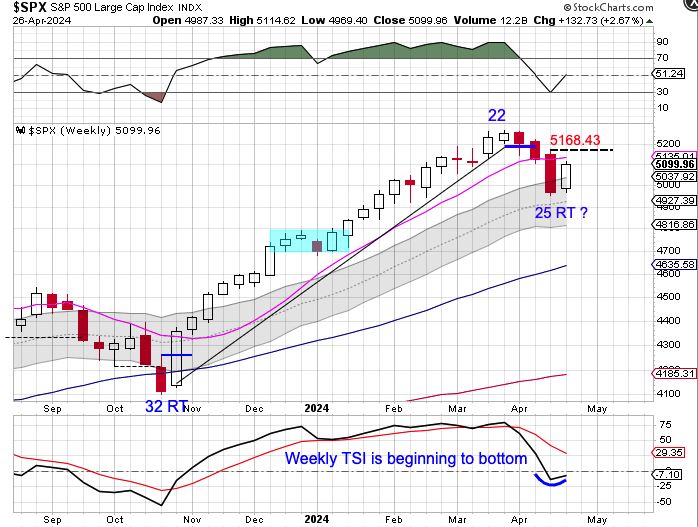
Stocks printed their lowest point on week 25, placing them in their timing band for an ICL. Stocks should turn the 10 week MA lower in order to complete their intermediate cycle decline — but that may not happen.  In The Weekend Report I discuss an early signal that indicates the ICL has been set. 

The entire Weekend Report can be found at Likesmoney Subscription Services

The Weekend Report discusses Dollar, Stocks, Gold, Miners, Oil, & Bonds in terms of daily, weekly and yearly cycles.
Also included in the Weekend Report is the Likesmoney CycleTracker

For subscribers click here.

Stocks Finding Their Footing

Stocks formed a swing high on Thursday.

Stocks closed above the 10 day MA on Tuesday and then higher again on Wednesday to signal day 72 as the DCL. However, as we discussed here, that the decline into the day 72 DCL caused the 10 day MA to decline sharply. So stocks may need to consolidate to allow the 10 day MA to flatten out before it can turn higher. It appears that stocks are beginning to find their footing on the lower timeframe.

Even through stocks closed lower for the day there is a new pattern of a higher high and higher low emerging on RSI 05. The 2 hour chart showed that stocks ran into resistance at the declining 50 MA and gapped down lower on Thursday. Stocks managed to rally off the daily low to close near the high of the day. Also notice the change in behavior on the 2 hour RSI 05. Prior to Thursday, RSI 05 was characterized by highs below the 70 line and lows below the 30 line. That is beginning to change with a new high above the 70 line and a new low above the 30 line. The next signal that we are watching for is for stocks to close above the 50 MA on the 2 hour chart as further confirmation that day 72 was the DCL.

Daily Cycle Low

Stocks closed love the 10 day MA on Tuesday.

Stocks printed their lowest point on Friday, day 72, placing them very deep in their timing band for a DCL. Stocks formed a swing low on Monday, so closing above the 10 day MA signals day 72 as the DCL. The decline into the day 72 DCL did cause the 10 day MA to decline sharply, so stocks may need to consolidate to allow the 10 day MA to flatten out before it can turn higher.

It is still too early to determine day 72 was also the ICL or if more more DCL is needed to complete the intermediate cycle decline. However, stocks did deliver a bullish signal on Tuesday. Stocks closed above the 50 line on RSI 05 on Tuesday. If RSI 05 goes on to embed in overbought that would indicate that stocks are now in the advancing phase of a new intermediate cycle.

Daily Cycle Low

Stocks formed a swing low on Monday.

Stocks printed their lowest point on Friday, day 72, placing them very deep in their timing band for a DCL. Monday’s swing low has good odds of marking the DCL. We will use a close above the 10 day MA to label day 72 as the DCL.

We will also need to watch the 50 day MA. A close above the 50 day MA would shift the odds that the ICL has been set. But if stocks are rejected by the 50 day MA, that will indicate a continuation of the intermediate cycle decline

The 4/20/24 Weekend Report Preview

The Dollar

The dollar is in the process consolidating below the 106.25 level.

The dollar did not manage to turn the 10 day MA lower at the day 24 low, so the status of the daily cycle is not clear.  The dollar is still stretched above the 10 day MA. A daily cycle decline will help to allow the 10 day MA to catch up to price. The dollar is in a daily uptrend.  A bullish break out of consolidation would indicate a continuation of its daily uptrend and signal a cycle band buy signal — in which we would then label day 24 as the DCL.

Stocks

Stocks closed below the 50 day MA on Monday then delivered bearish follow through on into Friday.

Stocks typically print a daily cycle low every 35 to 45 days. So at 72 days, stocks are overdue for a daily cycle low.  Stocks broke below the March low and are in the process of seeking out their ICL. Due to the extended daily cycle decline, stocks may not need another daily cycle to complete its ICL.  Stocks are currently in a daily downtrend. Stocks will remain in its daily downtrend unless it closes back above the upper daily cycle band.

The entire Weekend Report can be found at Likesmoney Subscription Services

The Weekend Report discusses Dollar, Stocks, Gold, Miners, Oil, & Bonds in terms of daily, weekly and yearly cycles.
Also included in the Weekend Report is the Likesmoney CycleTracker

For subscribers click here.


Bitcoin Bottom?

BTC formed a swing low.

BTC broke below the day 28 low overnight. Friday is day 30, placing BTC in the early part of its timing band for a DCL.  BTC appears to have found support at the 61000 level and is in the process of forming a bullish reversal off the 6100. A close back above the 10 day MA will have us label day 30 as an early DCL. BTC is currently in a daily downtrend. BTC will remain in its daily downtrend unless it closes above the upper daily cycle band.

Stocks Due For A Bounce

Stocks continued lower on Tuesday.

Stocks typically print a daily cycle low every 35 to 45 days. So at 69 days, stocks are overdue for a daily cycle low. Tuesday’s narrow range day eases the parameters for forming a swing low. A break above 5079.84 will form a swing low. Then a close above the 10 day MA will signal the new daily cycle. I plan to discuss in the Weekend Report what stocks need to do to convince me that the pending rally is not going to be a Dead Cat Bounce.

Correction

At 25 weeks, stocks are in their timing band for an ICL. Stocks formed a weekly swing high, broke below the weekly trend line and closed below the 10 week MA to signal the intermediate cycle decline.

Stocks should turn the 10 week MA lower in order to complete their intermediate cycle decline. Oftentimes an intermediate cycle decline retraces to the 38 fib level, which coincides with a previous consolidation zone. Stocks are currently in a weekly uptrend. They will remain in their weekly uptrend unless they close below the lower weekly cycle band.

YieldMax Rotation Strategy – Update

We discussed YieldMax ETF’s back on 4/1/24. We noted that there are trade offs. One trade off is limiting capital appreciation for consistent monthly dividends. Another trade off to consistent monthly dividends is exposure to full participation of drawdowns.  My YieldMax Rotation Strategy is to use a bullish/bearish crossover of the 10/20 MA’s as the buy/sell signal limits the downside drawdowns while participating in the capital appreciation.

With that said, it is time to take closer look at APLY & TSLY.

Both APLY and TSLY have been in a downtrend over the past 10 months. Both delivered buy signals this week. APLY averaged a monthly distribution of .4065 over this period which is an annualized 28.6% return. TSLY averaged a monthly distribution of 1.1909 over this period which is an annualized 93.32% return. With both APLY and TSLY delivering buy signals there is the potential for higher yields on the monthly distributions. Combined that with the potential of capital appreciation makes me appreciate these YieldMax ETFs.